 Stadium Seating Charts
MLB stadiums by capacity, biggest to smallest
The biggest MLB ballpark is Dodger Stadium, home of the Los Angeles Dodgers, with 56,000 seats. The smallest permanent MLB ballpark is Tropicana Field (Tampa Bay Rays) at 25,025; the Athletics play at Sutter Health Park, a 14,014-seat minor league park, until their Las Vegas stadium opens. The average MLB ballpark holds 41,460, not counting Sutter Health Park.
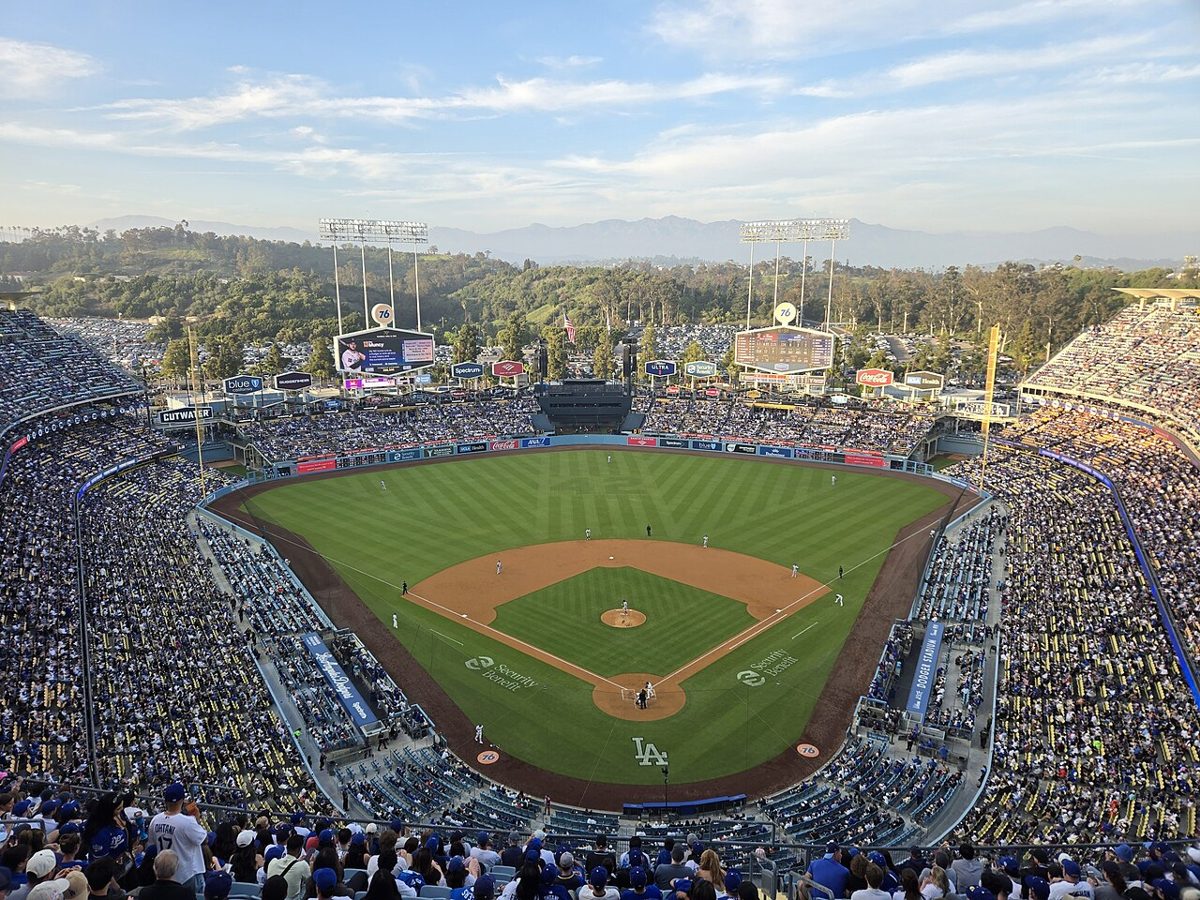
The six biggest MLB ballparks
Photo: Spatms, 2025, CC BY-SA 4.0, via Wikimedia Commons

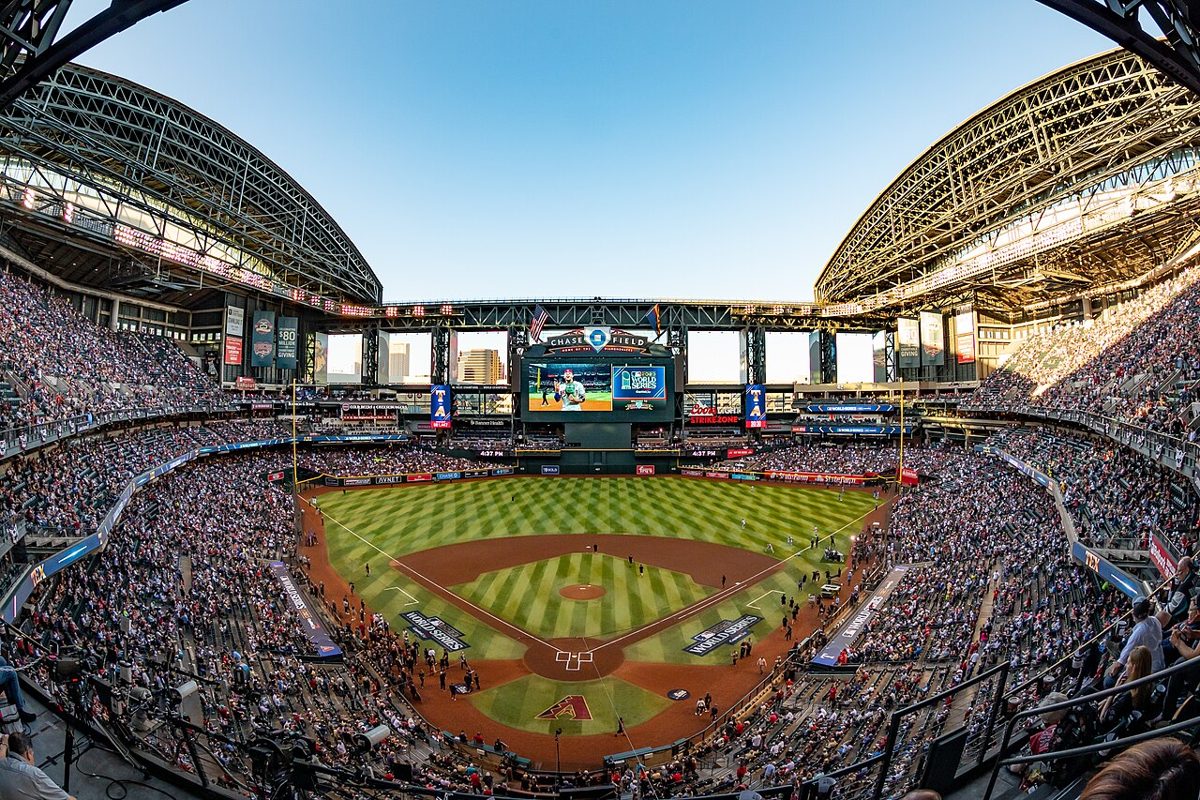
Photo: U.S. Air Force photo by Staff Sgt. Tyler J. Bolken, 2023, Public domain, via Wikimedia Commons

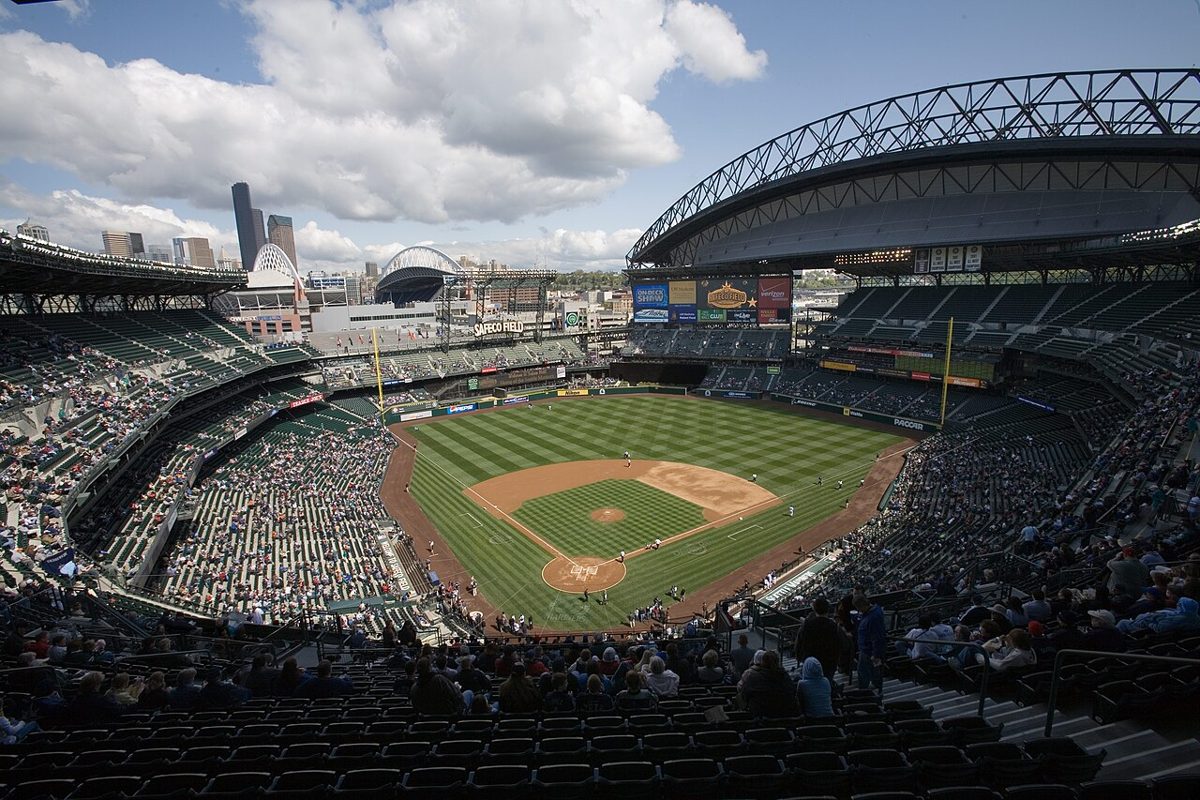
Photo: MyName (Cacophony), 2007, CC BY-SA 3.0, via Wikimedia Commons

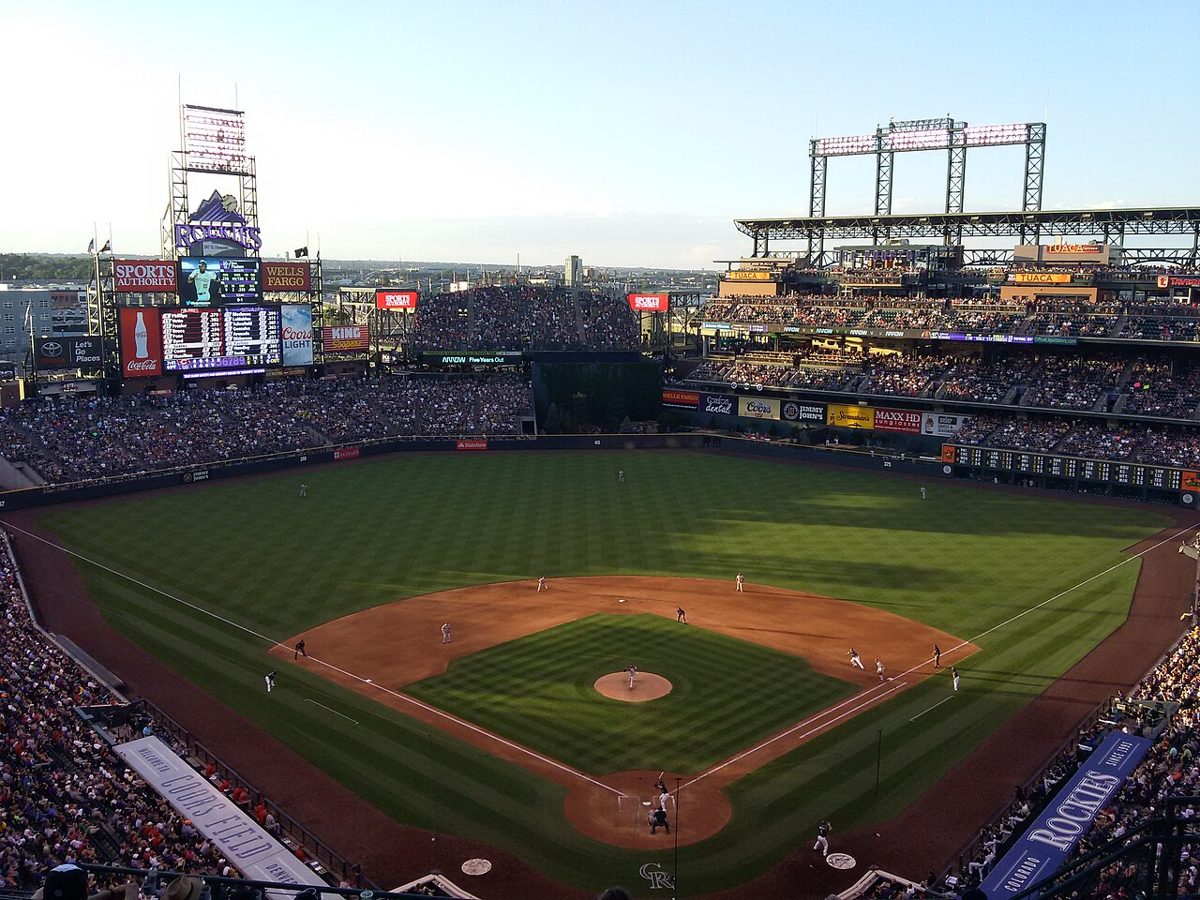
Photo: Thelastcanadian, 2015, CC BY-SA 4.0, via Wikimedia Commons

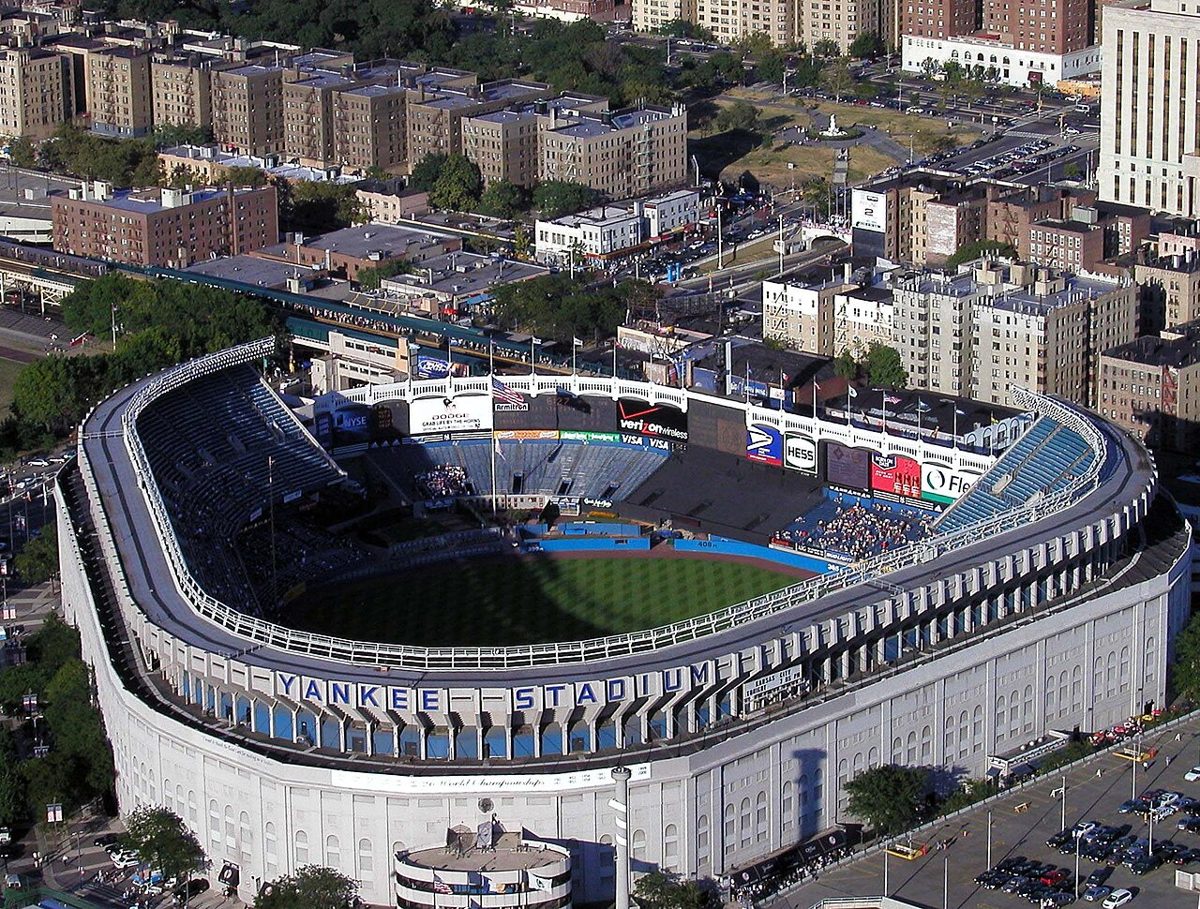
Photo: Severin St. Martin, 2002, CC BY 2.0, via Wikimedia Commons

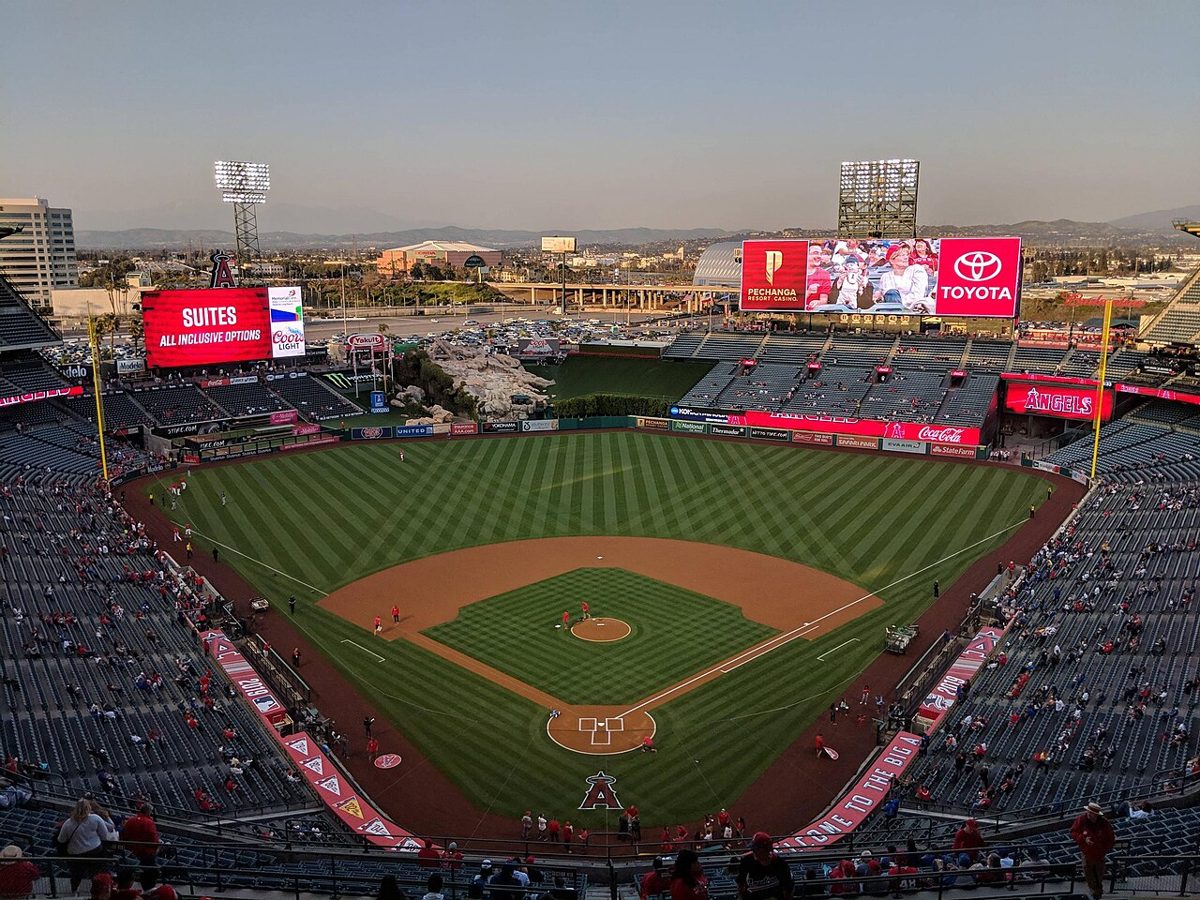
Photo: CrispyCream27, 2019, CC BY-SA 4.0, via Wikimedia Commons

All MLB ballparks by capacity
| # | Stadium | MLB team | Capacity | Location | Roof | Opened |
|---|---|---|---|---|---|---|
| 1 | Dodger Stadium | Los Angeles Dodgers | 56,000 (source) | Los Angeles, CA | open air | 1962 |
| 2 | Chase Field | Arizona Diamondbacks | 48,330 (source) | Phoenix, AZ | retractable roof | 1998 |
| 3 | T-Mobile Park | Seattle Mariners | 47,368 (source) | Seattle, WA | retractable roof | 1999 |
| 4 | Coors Field | Colorado Rockies | 46,897 (source) | Denver, CO | open air | 1995 |
| 5 | Yankee Stadium | New York Yankees | 46,537 (source) | Bronx, NY | open air | 2009 |
| 6 | Angel Stadium | Los Angeles Angels | 45,517 (source) | Anaheim, CA | open air | 1966 |
| 7 | Busch Stadium | St. Louis Cardinals | 44,383 (source) | St. Louis, MO | open air | 2006 |
| 8 | Great American Ball Park | Cincinnati Reds | 43,500 (source) | Cincinnati, OH | open air | 2003 |
| 9 | Citizens Bank Park | Philadelphia Phillies | 42,901 (source) | Philadelphia, PA | open air | 2004 |
| 10 | Oriole Park at Camden Yards | Baltimore Orioles | 42,455 (source) | Baltimore, MD | open air | 1992 |
| 11 | American Family Field | Milwaukee Brewers | 41,900 (source) | Milwaukee, WI | retractable roof | 2001 |
| 12 | Citi Field | New York Mets | 41,800 (source) | Queens, NY | open air | 2009 |
| 13 | Wrigley Field | Chicago Cubs | 41,649 (source) | Chicago, IL | open air | 1914 |
| 14 | Nationals Park | Washington Nationals | 41,373 (source) | Washington, DC | open air | 2008 |
| 15 | Truist Park | Atlanta Braves | 41,108 (source) | Atlanta, GA | open air | 2017 |
| 16 | Comerica Park | Detroit Tigers | 41,083 (source) | Detroit, MI | open air | 2000 |
| 17 | Daikin Park | Houston Astros | 40,963 (source) | Houston, TX | retractable roof | 2000 |
| 18 | Rate Field | Chicago White Sox | 40,615 (source) | Chicago, IL | open air | 1991 |
| 19 | Globe Life Field | Texas Rangers | 40,300 (source) | Arlington, TX | retractable roof | 2020 |
| 20 | Oracle Park | San Francisco Giants | 40,260 (source) | San Francisco, CA | open air | 2000 |
| 21 | Petco Park | San Diego Padres | 39,860 (source) | San Diego, CA | open air | 2004 |
| 22 | Rogers Centre | Toronto Blue Jays | 39,150 (source) | Toronto, ON | open air | 1989 |
| 23 | PNC Park | Pittsburgh Pirates | 38,747 (source) | Pittsburgh, PA | open air | 2001 |
| 24 | Target Field | Minnesota Twins | 38,544 (source) | Minneapolis, MN | open air | 2010 |
| 25 | Kauffman Stadium | Kansas City Royals | 38,053 (source) | Kansas City, MO | open air | 1973 |
| 26 | Fenway Park | Boston Red Sox | 37,755 (source) | Boston, MA | open air | 1912 |
| 27 | loanDepot park | Miami Marlins | 36,742 (source) | Miami, FL | retractable roof | 2012 |
| 28 | Progressive Field | Cleveland Guardians | 33,530 (source) | Cleveland, OH | open air | 1994 |
| 29 | Tropicana Field | Tampa Bay Rays | 25,025 (source) | St. Petersburg, FL | fixed roof | 1990 |
| 30 | Sutter Health Park | Athletics | 14,014 (source) | West Sacramento, CA | open air | 2000 |
What is the average MLB stadium capacity?
41,460 seats across the 29 permanent MLB ballparks.
Also: MLB ballparks by age · every MLB ballpark guide.
How this list is built
Capacity is each venue's official seating capacity for its main sport, taken from the team or venue's own page, or the stadium's Wikipedia infobox where the official page gives none. Each figure links to its source. Standing room, temporary seats and record crowds are not counted. Opening year is the year the current stadium first hosted its main tenant. Figures are checked against the source each month; if you spot an outdated number, the source link beside it shows where it came from.
Free to use with a link to this page. Stadium photos: Wikimedia Commons, credited under each photo and on our photo credits page.